Nail Your First Step to The Cloud

All too often we shine a flashlight on just one or two areas of a business’s technology footprint when planning a cloud migration. Whether it is just the server inventory, the storage footprint — or sometimes even the network — planning based only on these few signals is not enough to be successful.
A successful cloud readiness assessment involves a multi-faceted approach to discovery, bringing data in from both the ops team’s data sources as well as the business.
Turn up the house lights
We see the following steps of data gathering working well to support the assessment:
- Solicit business goals and objectives for the cloud migration initiative
- Inventory your servers, databases and storage footprint
- Inventory your applications, in terms that the business uses*
- Create basic dependency maps of your applications to the infrastructure they use
- Catalogue the application technologies employed
- If the team is really good, collect network traffic to create detailed dependency maps
(*) I want to see more than just the acronyms that Ops use. You know who you are…
Let’s dig into these a little more:
1. Solicit Business Goals
This is critical for being successful in your project, yet so many teams go into these projects without this clarity.
Word of advice: Have measurable goals before the initiative gets past week two.
These objectives may be as high level as ”Save $1bn in OpEx annually” or as specific as ”Reduce time to recovery for application XYZ to 4hrs”, but the point is to have them and to know them.
There will be many decision points on your cloud journey that will be solved quickly with these targets in mind. Without them, you’re in for countless hours of revolving discussion about which shade of blue is bluer.
2. Create Compute, Data & Storage inventory
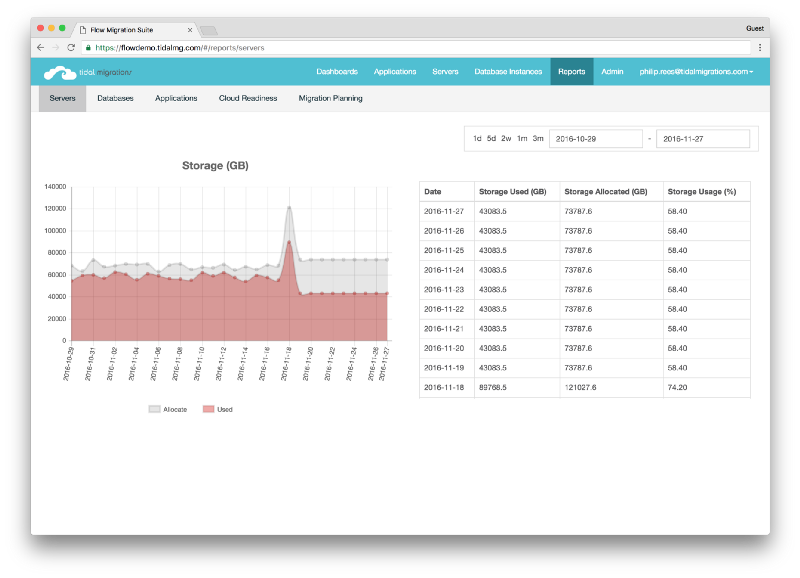
You may be surprised to see this so soon, but there’s a great reason: start capturing this data early on and you will quickly see usage trends over time before big migration decisions need to be made.
This data includes CPU, Memory, Disk (usage and allocated for all), as well as your database instances — their catalogs, log sizes etc.

While most projects that we see fail either don’t have this or rely on Excel extracts from multiple systems, do yourself a favour and create a daily extract into a time-series database call me.
This will give you a consolidated view of your entire environment with just enough fidelity for migration planning, but not so much that your ops team will complain about yet-another-monitoring-tool.
3. Application Inventory
If you’re one of the few organizations that already practices Application Portfolio Management, this should be a simple extract. :)
For most teams, this requires consolidating data from various billing, CRM, and even Ops systems to create a list of applications that we think we’re about to disrupt.
With this new found list of applications, fill in some details that are pertinent to your business goals we identified in step 1. For example, if your objectives include cost savings, solicit numbers on TCO and value to the business for each application.
Don’t do this in excel. You need to divide and conquer and capture this data over time. If you aren’t already using Tidal Migrations to do this assessment, consider using Google Docs or Sharepoint to collaborate more effectively.
4. Create basic dependency maps
A basic dependency map is one that shows, at a high-level, which applications are running on what servers in your enterprise. We tend to stick to three levels of depth here: Applications, Database instances, and Servers.
The goal of this step is to highlight the level of complexity that each application has, and start to gain an understanding of the underlying infrastructure. We’ll get to mapping network flows to applications later on.
5. Catalogue the application technologies
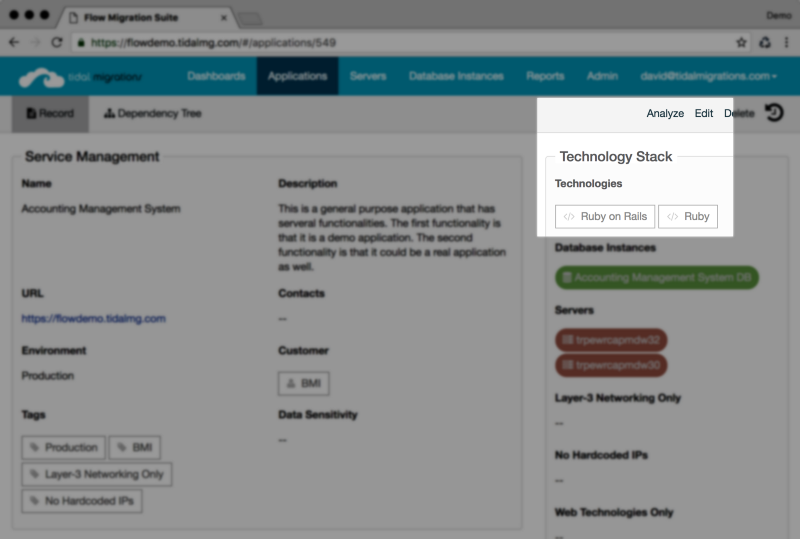
The goal here is to have the technology dependencies captured so that we can map which apps would be suitable for which services later on in the cloud readiness assessment. Data gathering techniques include deploying agents to servers, scanning source code … the list is long.
If you’re using Tidal Migrations, use the application Analyze feature to easily scan your application stacks.
 Tidal Migrations’ “Analyze” button
6. Network dependency maps
Where the rubber meets the road.
This step augments all of the above with detailed network assessment data, derived from either sFlow/NetFlow, or raw packet captures for analysis. Some tools advocate the use of polling server’s `netstat` command and parsing the output, but from experience, this will only yield partial results.
There are some open source tools to help capture and analyze network traffic, such as nprobe/ntopng and fprobe as well as many commercial products. The trick here is mapping the traffic you discover back to the servers and applications that you inventoried earlier.

Capturing network traffic for one to three months before a migration is recommended, in order to detect those critical but once-in-a-while dependencies that inevitably exist.
No Silver Bullet?
Both network discovery techniques PLUS a consultative approach are required to ensure a successful data gathering exercise. The more data you capture, the more information you can leverage to the cloud readiness assessment phase which will shorten the time needed in both migration planning and execution phases.
-David
Chief Migration Hacker, Tidal Migrations